
The Quantitative Blind Spot: Why Numbers Alone Can't Fix Funnels
Web analytics platforms like Google Analytics, Mixpanel, and PostHog are indispensable for tracking top-level business health. They provide precise numbers: your bounce rate is 64%, your cart abandonment is 71%, and your average page duration is 48 seconds.
However, quantitative data possesses a major blind spot: it tells you what happened, but completely fails to explain why it happened. When 500 people drop off at your pricing table, the raw number cannot tell you whether they found the price too expensive, got confused by feature terminology, or tried clicking an unlinked graphic and assumed your site was broken.
This is where qualitative behavioral tools—specifically heatmaps and session recordings—become a superpower for growth teams. They bridge the gap between abstract numbers and human behavior.
The 3 Core Heatmap Types and What They Reveal
1. Click & Tap Maps: Identifying Dead Clicks and Distraction Paths
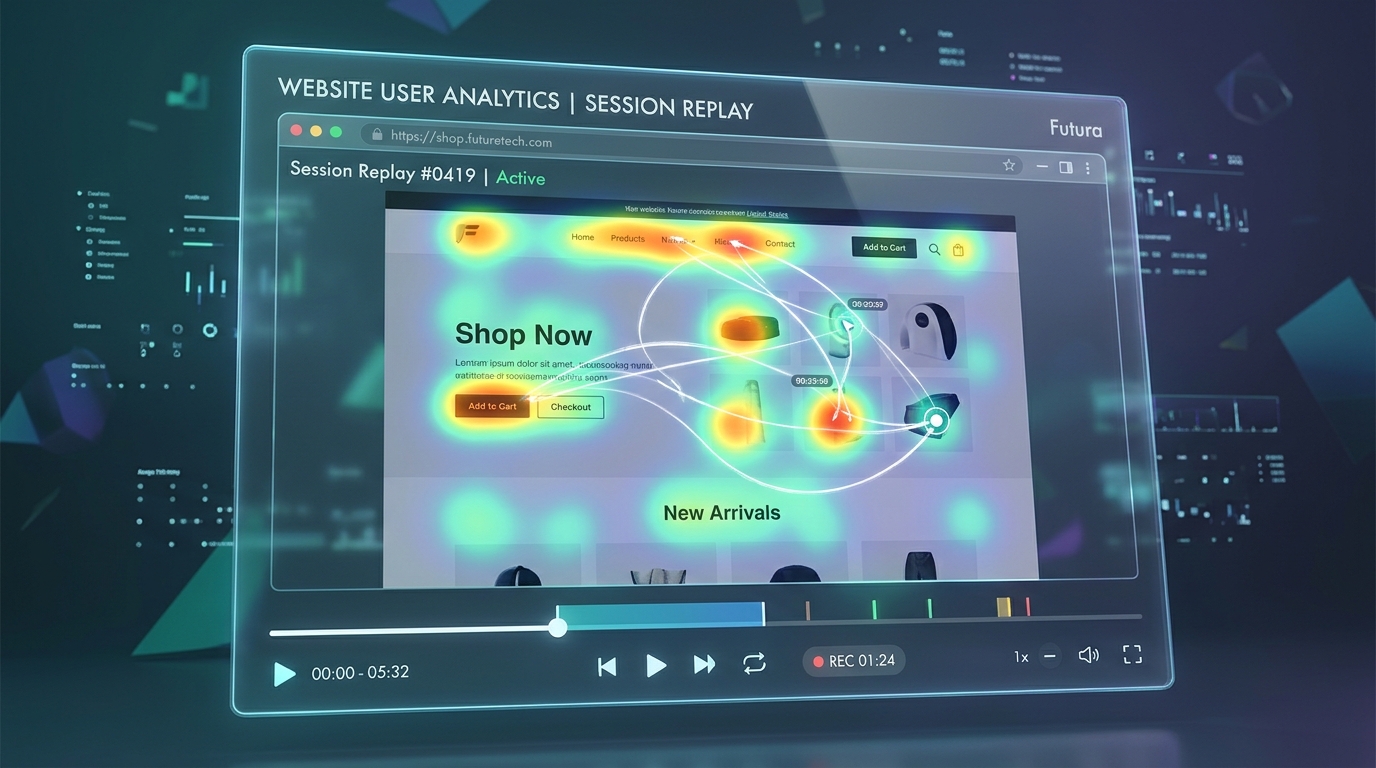
Click maps aggregate every desktop mouse click and mobile screen tap into a thermal overlay. When analyzing a click map, you should immediately search for two diagnostic anomalies:
- Dead Clicks: Users clicking on non-interactive elements. If dozens of visitors repeatedly click on a trust icon or an illustrative screenshot, they expect that element to open a modal or expand for more detail. Either make it interactive or redesign it so it does not mimic button affordance.
- Distraction Clicks: Users clicking secondary navigation links or decorative badges instead of your primary conversion goal. This reveals visual clutter pulling attention away from revenue.
2. Scroll Depth Maps: Discovering Where Attention Drops Off a Cliff
Scroll depth maps display how far down the page visitors scroll before leaving. On most commercial landing pages, you will observe a steep drop-off just below the hero fold, with another significant drop-off around the 50% mark.
If your most persuasive content—such as verified client testimonials, warranty details, or key pricing calculators—is situated below an 80% scroll drop-off line, four out of five visitors will never see it. Move your most compelling evidence higher up the page.
3. Movement & Hover Maps: Tracking Hesitation and Attention
Numerous eye-tracking studies have proven a direct statistical correlation between mouse cursor movement and visual eye focus. When users hesitate, read carefully, or ponder a purchasing decision, their cursor tends to track along the text or hover over key pricing elements.
Spotting Critical Friction Signals in Session Recordings
Session recordings provide chronological playback of individual browsing sessions. While watching hours of random sessions is unproductive, filtering for specific behavioral friction signals allows you to diagnose major bugs in under 20 minutes a week.
Rage Clicks: The Universal Screaming Signal
A rage click occurs when a user rapidly clicks the same element multiple times within one or two seconds. It is the digital equivalent of hammering an unresponsive elevator button. Rage clicks almost always signal broken JavaScript, unresponsive links, slow-loading payment modals, or deceptive UI designs that look clickable but do nothing.
Dead Clicks and Erroneous Form Submissions
When a user fills out a lead form, clicks "Submit", and nothing happens because of an invisible validation error that failed to scroll into view, the user typically clicks two or three more times, pauses in confusion, and leaves forever. Watching this unfold in a recording allows you to fix the validation feedback immediately.
Heatmap Anomaly Diagnostic Matrix
| Visual Diagnostic Pattern | Underlying User Experience Friction | Business Consequence | Actionable Engineering / Design Fix |
|---|---|---|---|
| Cluster of clicks on static product image | User expects lightbox zoom or alternative color preview | Frustration exit / Perception of broken site | Add a tap-to-zoom modal or interactive thumbnail switcher. |
| 75% scroll drop-off before pricing table | Excessive hero padding / Fluff content pushing prices too low | Users leave before ever seeing plan details | Trim hero height and place a jump-link anchor ("See Pricing") above the fold. |
| Rage clicks on "Next Step" checkout button | Form validation error occurs off-screen with no visual notification | High checkout drop-off at final payment hurdle | Auto-scroll the viewport to the highlighted invalid field with clear error text. |
| Rapid mouse shaking / Erratic cursor movement | Confusion about where to find shipping, sizing, or contact info | High bounce rate due to cognitive fatigue | Add an obvious FAQ drawer or conversational assistance widget. |
Case Study: How an Online Retailer Cut Checkout Bounce by 24% in 20 Minutes
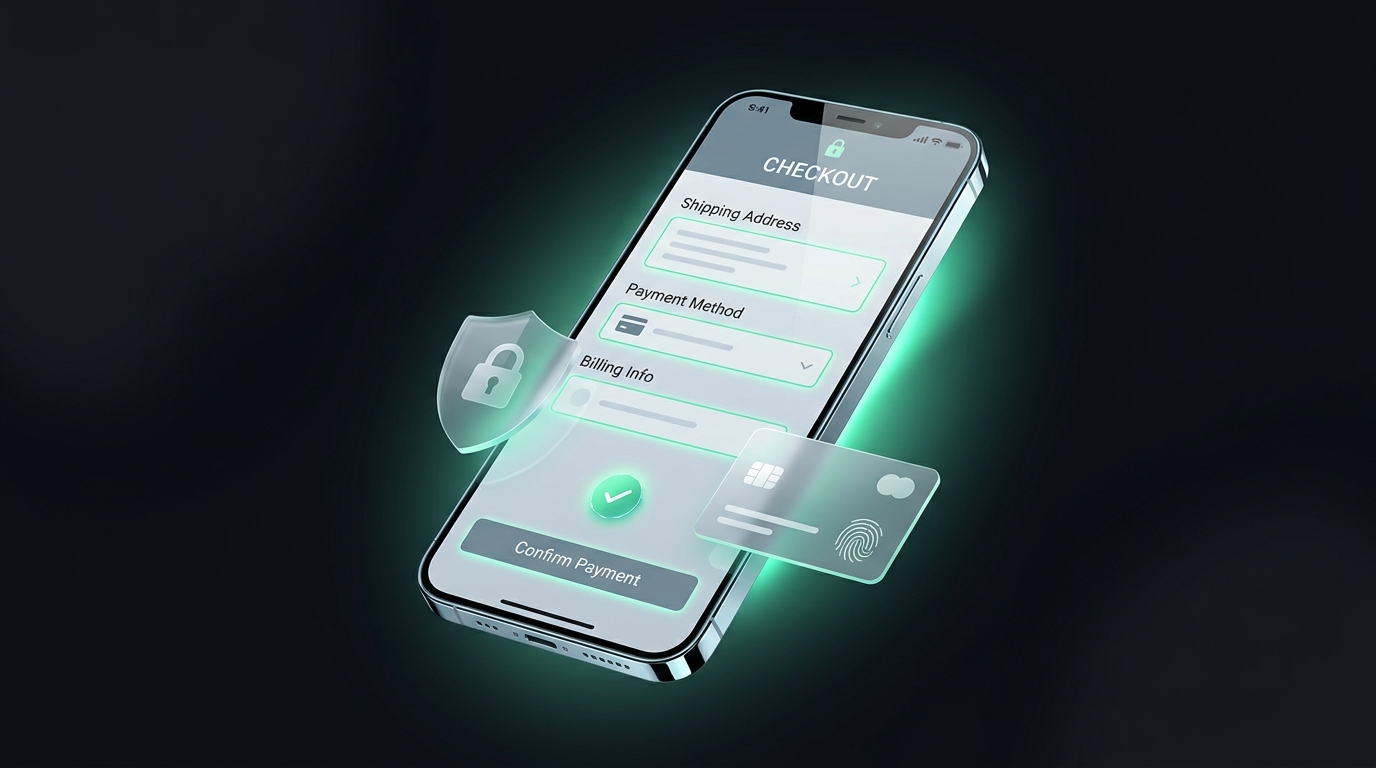
An e-commerce store selling premium audio equipment noticed a high drop-off on their checkout shipping screen. Over 30% of shoppers who entered their shipping address never reached the credit card screen.
The marketing manager filtered session recordings specifically for sessions with rage clicks on the checkout URL. Within ten minutes, a glaring issue emerged: when international visitors entered their postal code, an automated tax calculation script took 3.5 seconds to compute the final total. During those three seconds, the "Continue to Payment" button remained visually enabled but non-functional.
Shoppers repeatedly clicked the button, assumed the payment gateway was frozen, and closed their browser. The fix took thirty minutes of developer time: adding an animated loading spinner over the button with the label "Calculating taxes..." and disabling clicks until the computation was complete. Checkout bounce dropped by 24% immediately.
A Practical 20-Minute Weekly Review Workflow for Lean Teams
- Filter for Friction, Not Volume: Do not watch random browsing sessions. Filter your recording tool for sessions with Rage Clicks > 0 or Cart Abandonment = True.
- Review 5 to 8 Sessions at 2x Speed: Watch how visitors navigate form fields and buttons. Look specifically for hesitation pauses and repeated clicks.
- Log Friction Items in an Engineering Backlog: Categorize issues into immediate bugs (broken validation, slow buttons) vs usability enhancements (unclear copy, missing reassurance).
- Review Scroll Depth on Your Top 3 Revenue Pages: Ensure your core value proposition and primary CTAs sit within the top 50% scroll zone.
Conclusion: See Your Website Through Your Customer's Eyes
Quantitative dashboards and conversion funnels will show you the exact drop-off rates, but they will never tell you the human story behind those exits. Qualitative visual tools provide the empathy, context, and clarity required to understand real user struggles.
By establishing a simple 20-minute weekly review routine—filtering for rage clicks, auditing scroll drop-offs, and tracking dead clicks—you stay intimately connected to how actual people experience your product. When you eliminate the hidden bugs, confusing layouts, and unresponsive elements that frustrate visitors, you build a smoother, more enjoyable buying experience that directly lifts your bottom line.